Dealership sales and stock reporting in Power BI
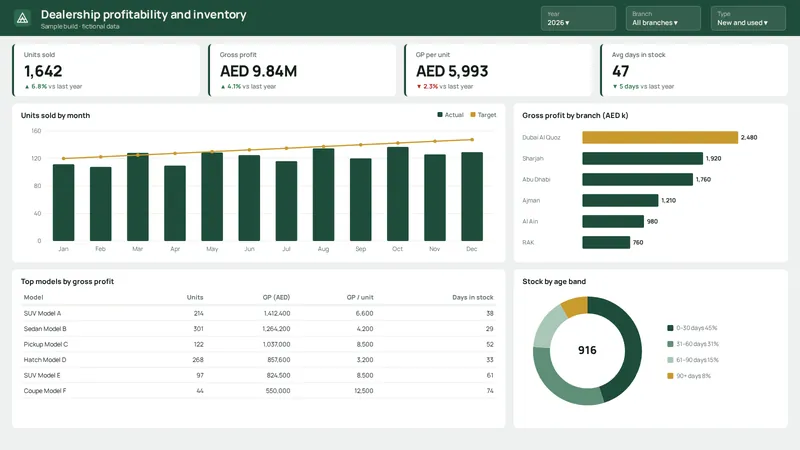
Replacing a monthly spreadsheet pack with one Power BI report for sales, gross profit and stock ageing across branches.
Read the exampleWork
Everything on this page is built on fictional data and labelled as a sample or demo. Client projects are kept confidential unless the client agrees to be named.
Margin per car, per make and per salesperson, stock ageing and lead sources in one Power BI report, with a weekly summary sent automatically. From $600.
Common scenarios showing the problem, what gets built and the goal it aims for. These are examples, not client case studies, and the aims are targets rather than measured results.
Replacing a monthly spreadsheet pack with one Power BI report for sales, gross profit and stock ageing across branches.
Read the exampleBringing enquiries from web forms, WhatsApp, ads and missed calls into one workflow that replies fast and assigns an owner.
Read the exampleMoving project updates, approvals, quotations and files out of email threads into one secure workspace per client.
Read the exampleChoose a dashboard, filter by branch or period, then select chart bars to explore the matching records. Every company, name and figure is fictional.
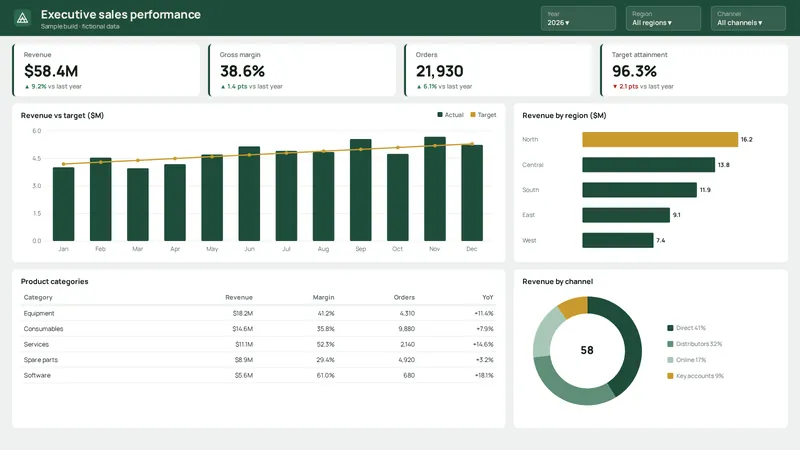
Interactive website demo · fictional data · Currency values in USD. These browser charts illustrate the reporting experience; they are not connected to a live Power BI report or customer records.
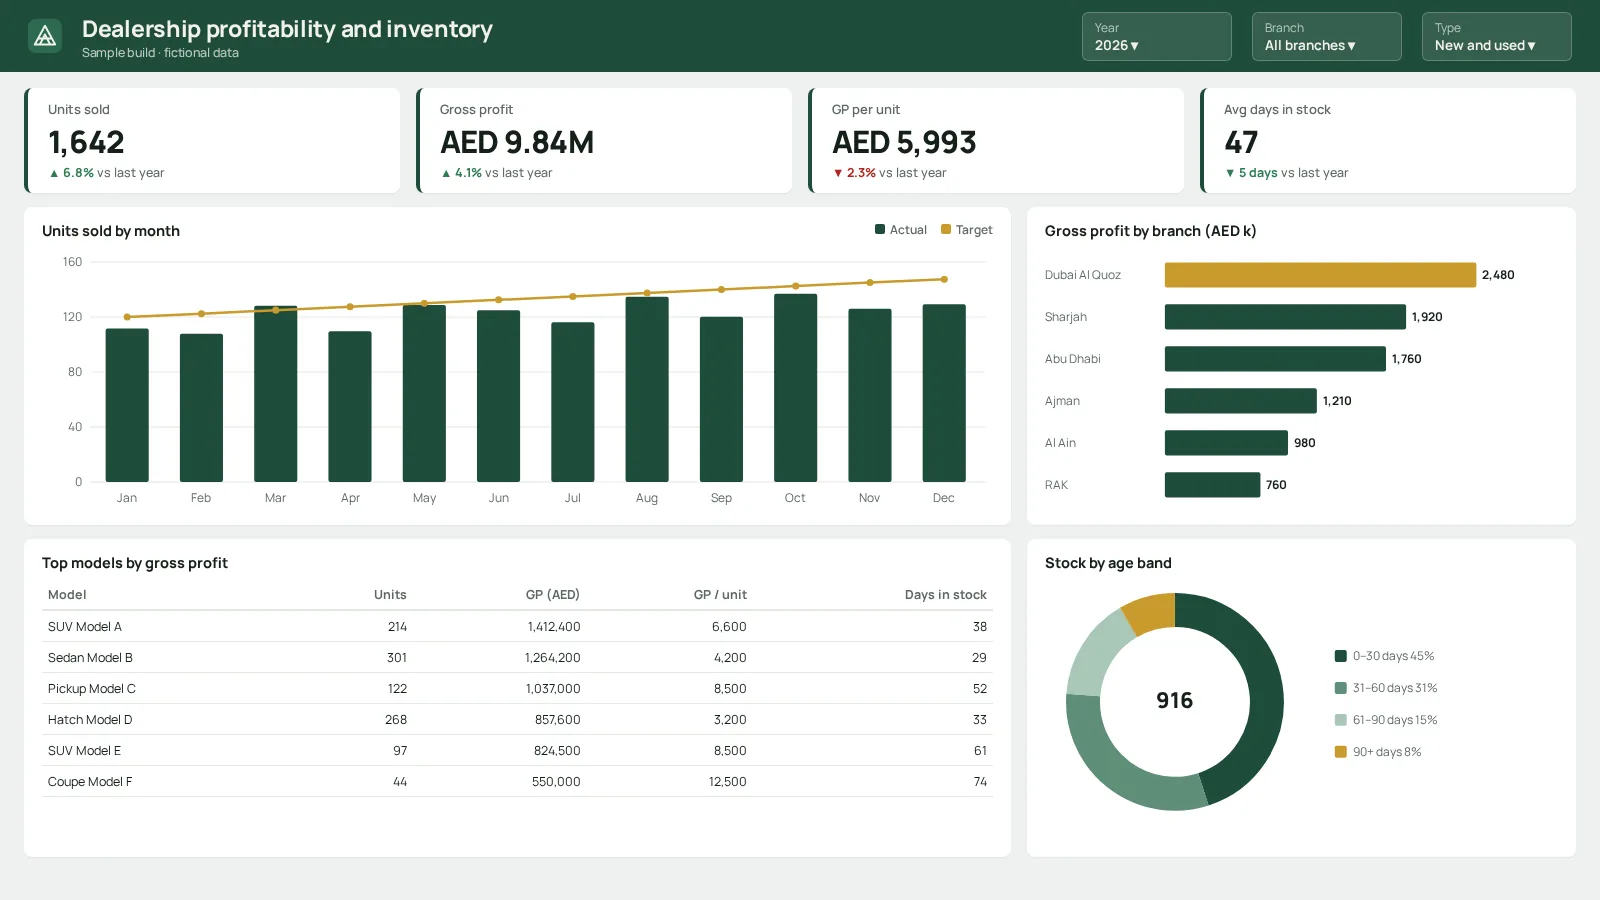
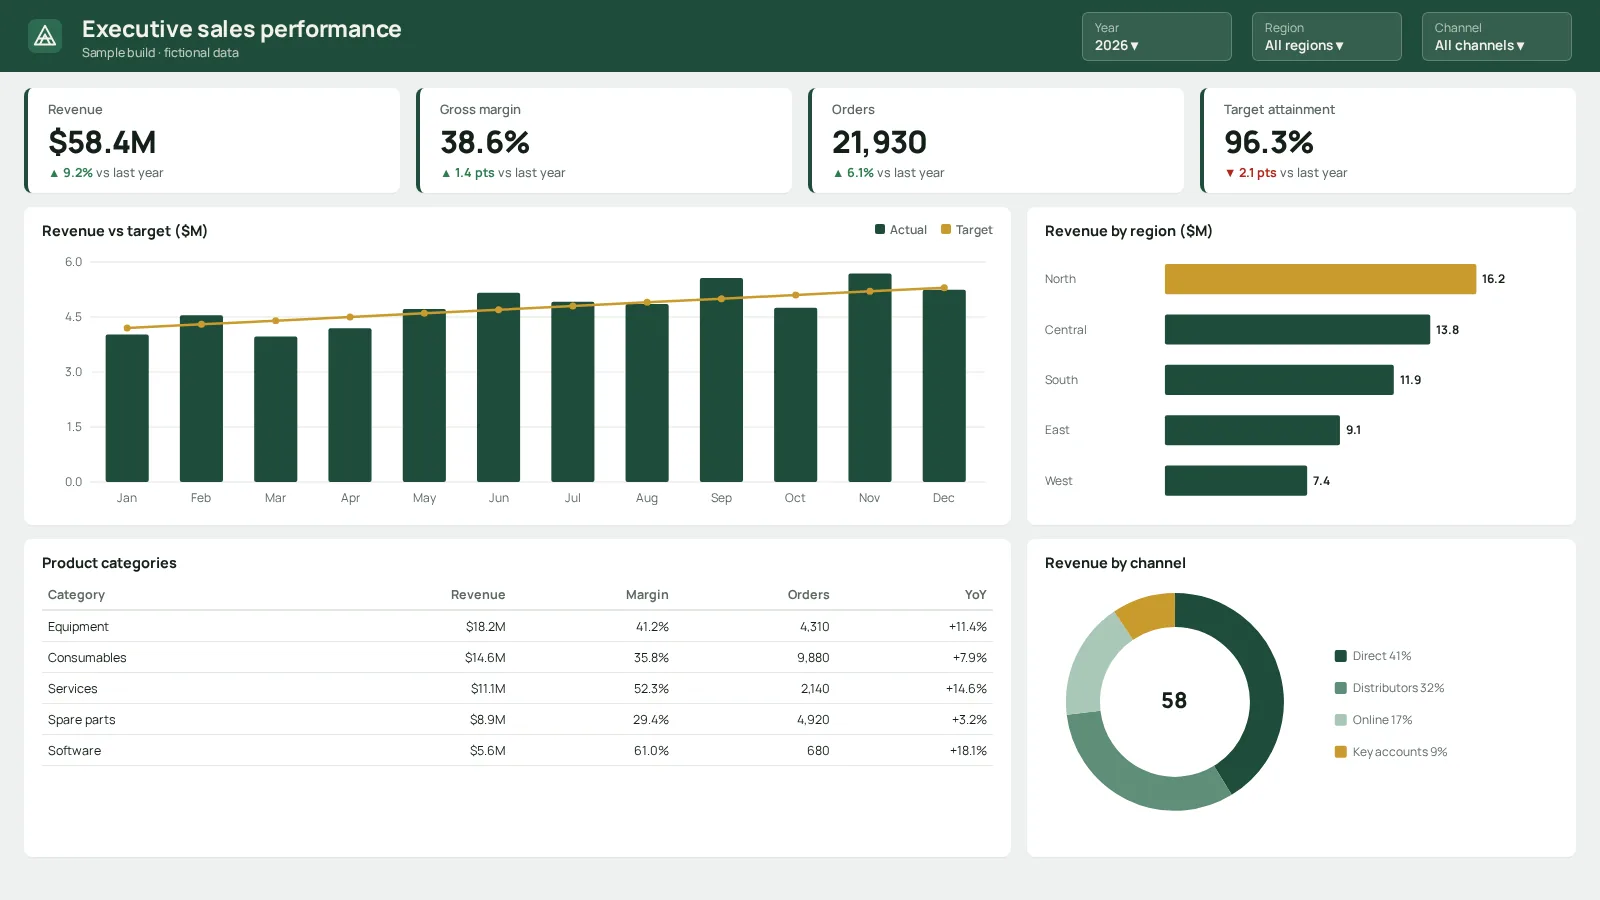
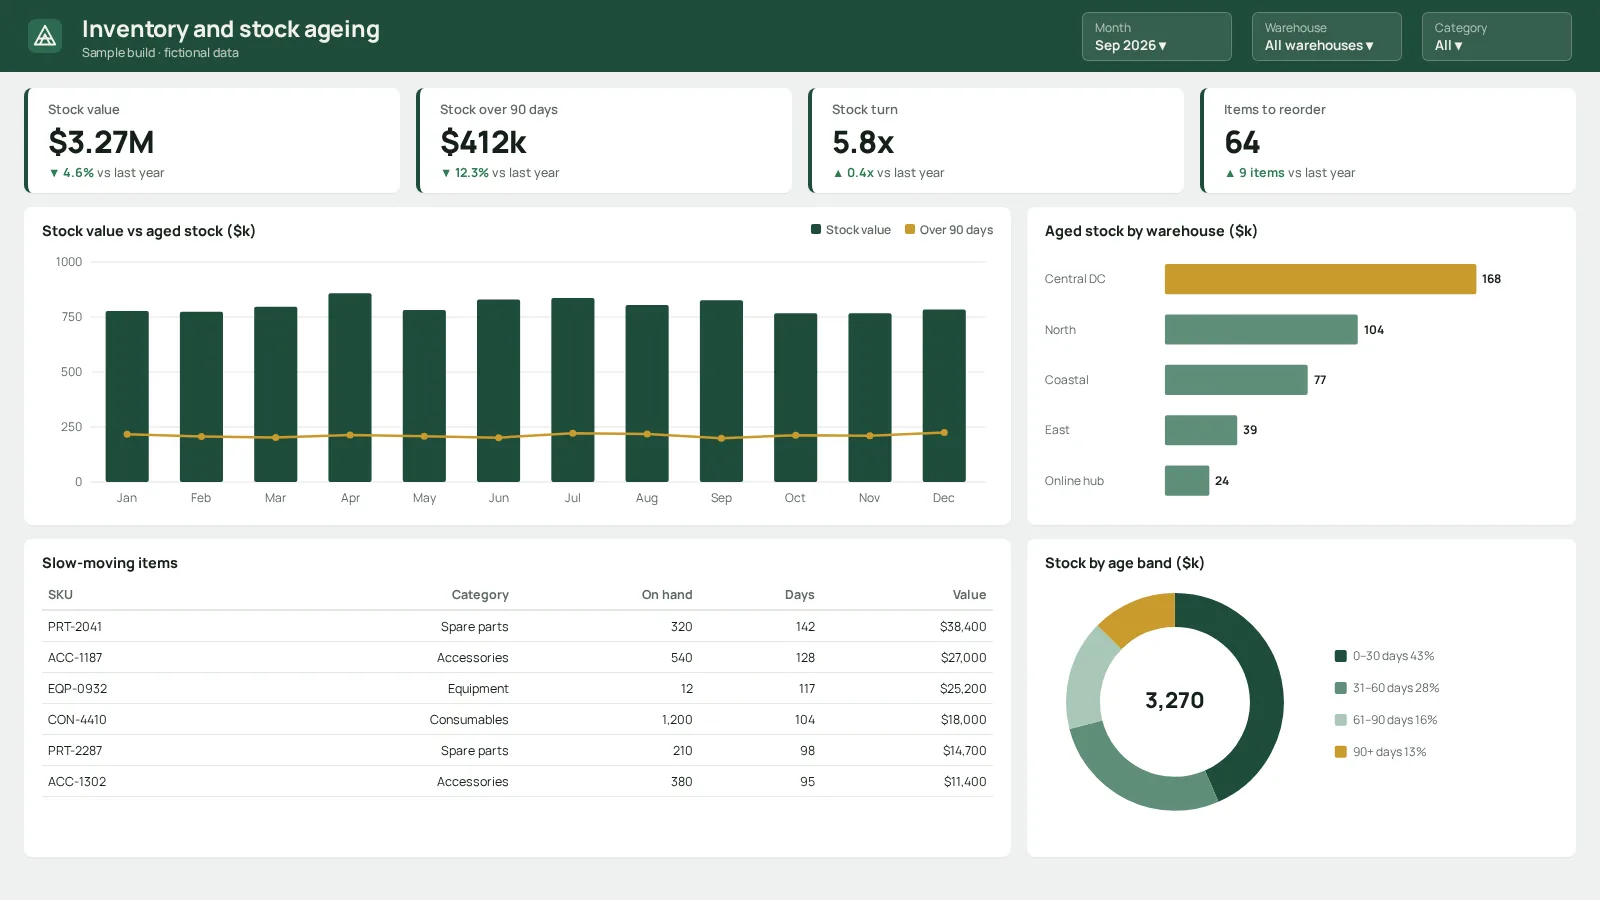
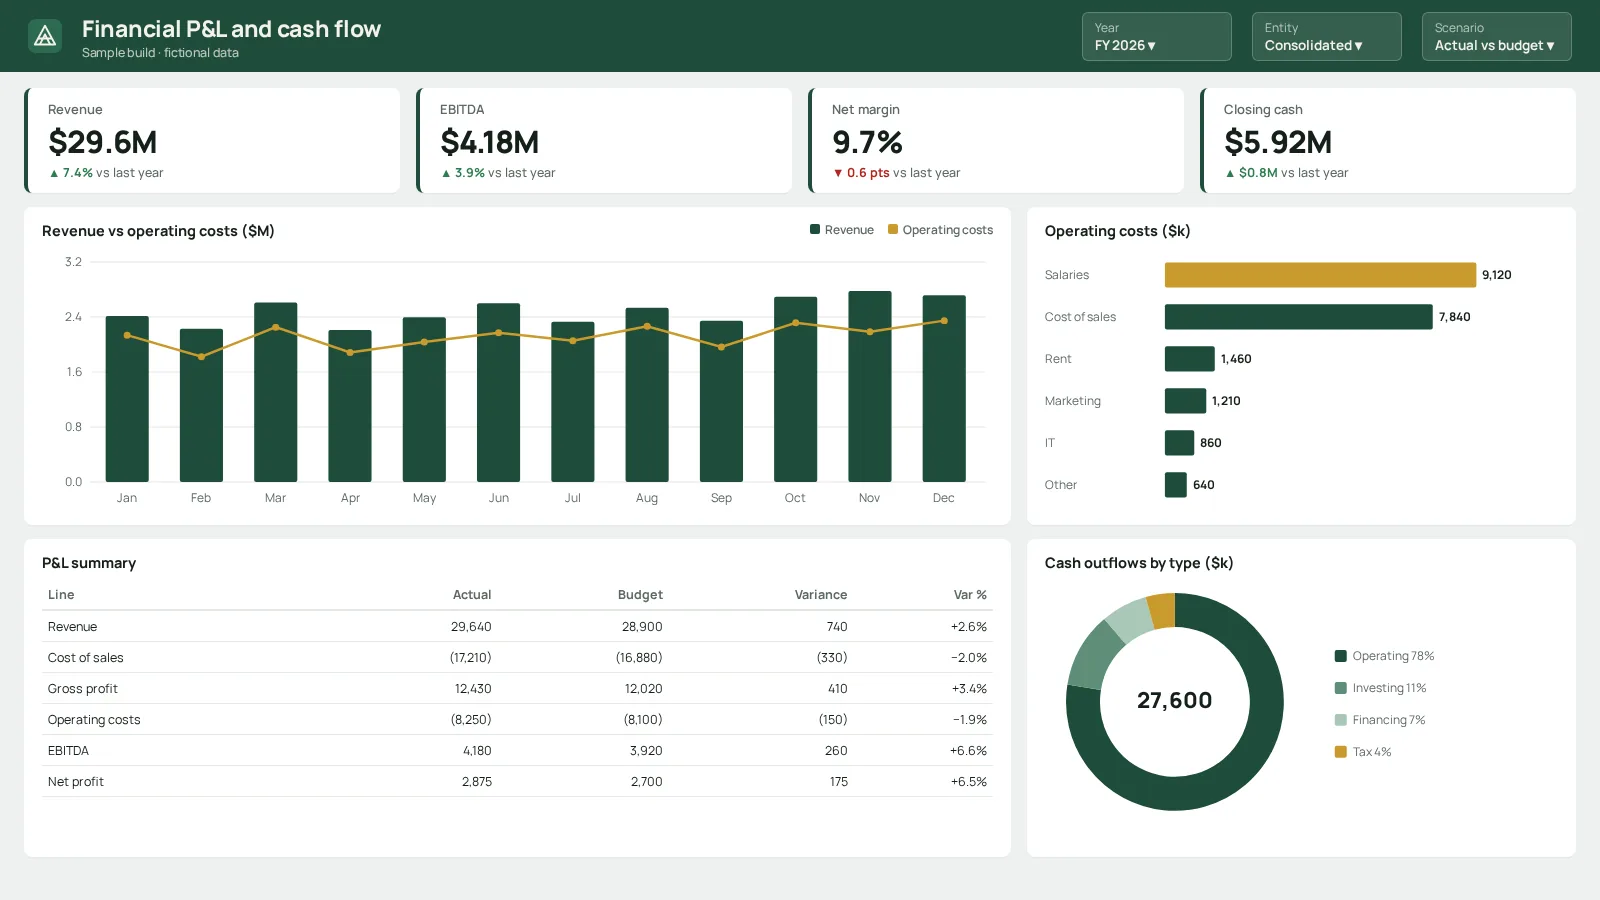
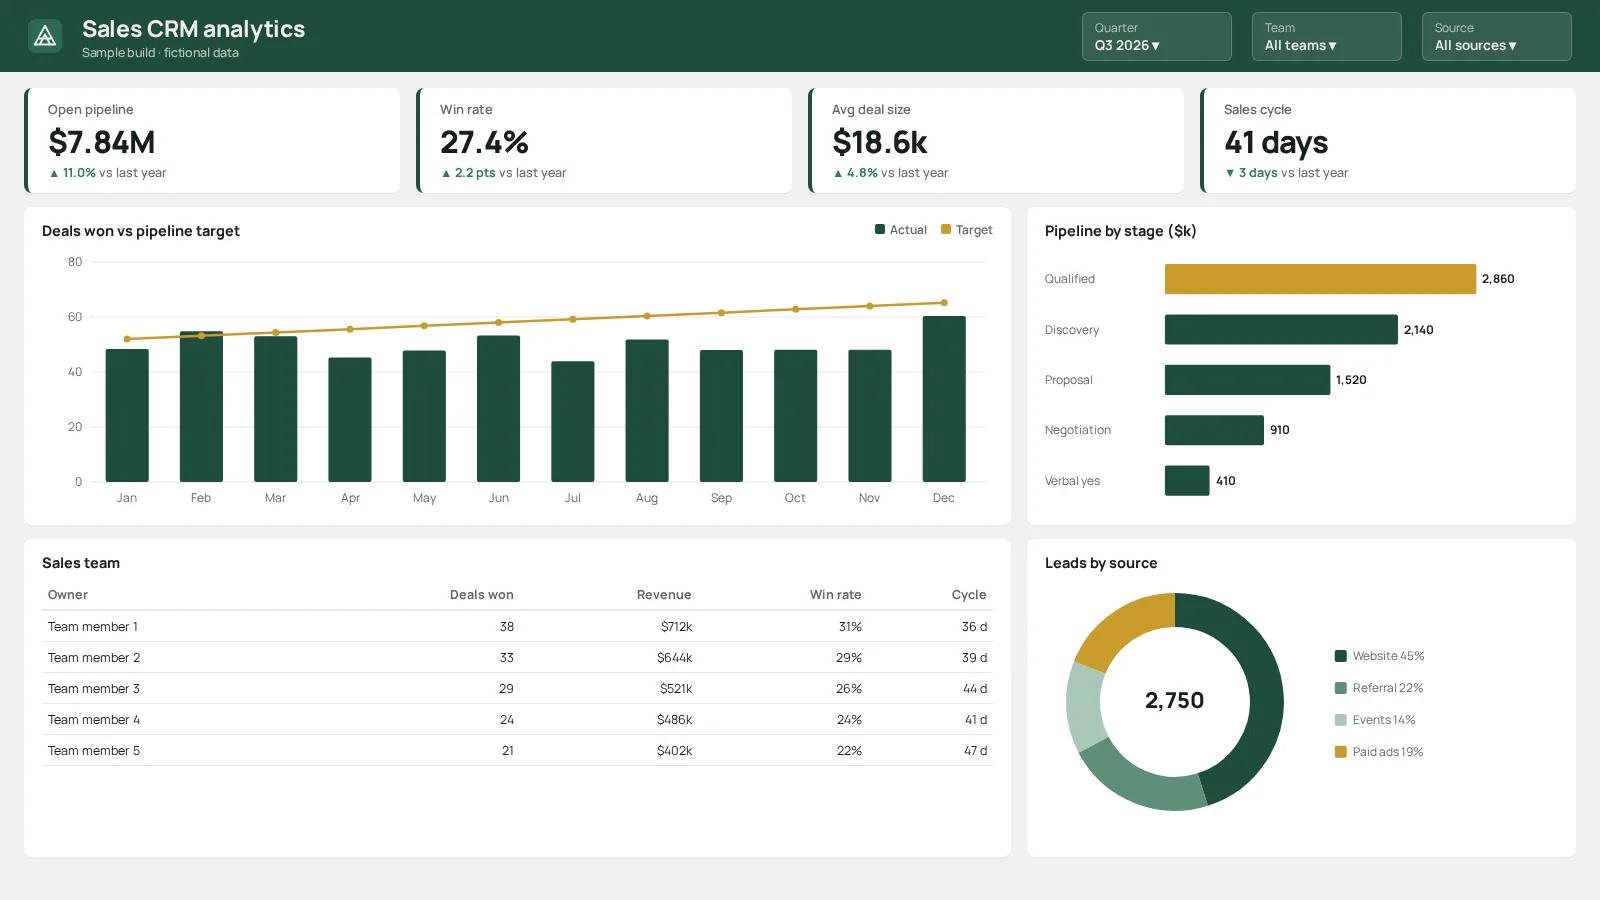
Open any card to try its own dashboard above. Change branch and period filters, select chart bars and inspect the matching records. These browser samples use fictional data to demonstrate reporting ideas; they are not live Power BI embeds.
Compare gross profit by make, vehicles sold and stock receipts across branches.
Open interactive dashboardCompare product revenue, order counts and average order value across branches.
Open interactive dashboardFind ageing stock, compare days on lot and inspect individual vehicles.
Open interactive dashboardCompare channel profit, operating costs and monthly cash movement.
Open interactive dashboardCompare net sales, transactions and average basket value by product group.
Open interactive dashboardCompare order revenue, returns, selling costs and contribution profit by channel.
Open interactive dashboardInspect pipeline stages, deal values and won sales across branches.
Open interactive dashboardCompare paid hours, absence, overtime and payroll across departments.
Open interactive dashboardInspect billed revenue, delivery costs and contribution by project type.
Open interactive dashboardCompare completed cases, on-time completion and net backlog added by process.
Open interactive dashboardPrioritise outstanding invoices by overdue age and inspect payment balances.
Open interactive dashboardCompare billed labour and materials, direct costs and gross profit by job type.
Open interactive dashboardCompare planned spending, actual costs and archived monthly forecasts.
Open interactive dashboardCompare scrap weight, usable output and waste rates by production stage.
Open interactive dashboardCompare certified work, actual costs, budget variance and delivery margin.
Open interactive dashboardCompare forecast demand with actual demand and inspect forecast errors.
Open interactive dashboardCompare revenue, branch contribution and margin across business lines and offices.
Open interactive dashboardCompare campaign spend, leads, acquired customers and cost per lead.
Open interactive dashboardCompare scheduled visits, completed work, first-time fixes and on-time visits.
Open interactive dashboardReconcile fictional posted invoice totals with extracted reporting values.
Open interactive dashboardInspect validation rules, issues found, resolved exceptions and example repairs.
Open interactive dashboardCommon workflows, described by the problem they solve and the tools involved. Each one is adapted to the apps and rules of the business using it.
A project portal where a client can follow milestones, approve deliverables, review quotations and exchange files. The backend is Django and PostgreSQL with role-based access and automated browser tests.
The demo runs in your browser with a fictional project. Nothing you enter is sent anywhere.