A profit dashboard
Margin per car, per make and per salesperson, with stock ageing and best and worst sellers.
Power BI for car dealerships
A Power BI dashboard for car dealerships that shows margin per vehicle, how long each car has been in stock, and which lead sources bring real buyers. A short summary reaches you every week on WhatsApp or email without anyone building a report.
Dealer Profit Dashboard From $600
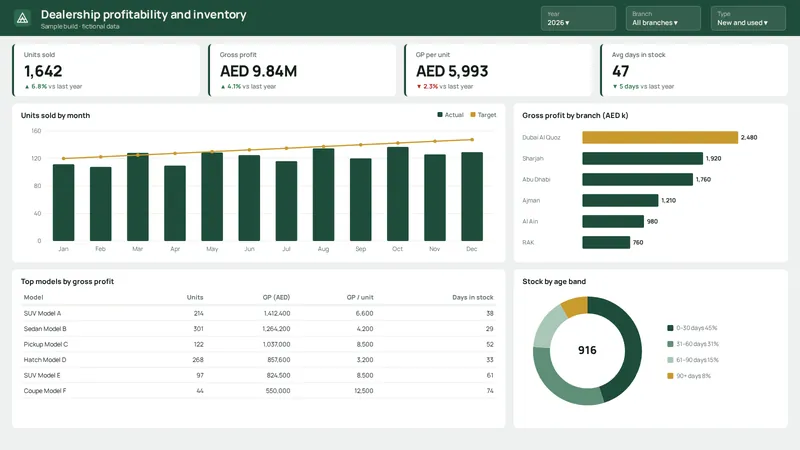
Interactive website demo · fictional data · Currency values in USD. These browser charts illustrate the reporting experience; they are not connected to a live Power BI report or customer records.
The offer
One fixed-scope project, delivered remotely, built from your own inventory and sales records.
Margin per car, per make and per salesperson, with stock ageing and best and worst sellers.
An n8n workflow collects the latest numbers and sends the owner a short summary by WhatsApp or email. If it fails, you get an alert and a manual fallback.
A walkthrough call and written notes on how to refresh the data, so you do not depend on me for routine updates.
Process
A call and a look at your current spreadsheets or dealer software exports.
A written scope with deliverables, timeline and price before work starts.
Dashboard totals are checked against your source records before you see them.
Walkthrough, documentation and the weekly report switched on.
Cost
Final price is set in a written scope after the first call, based on how many data sources you have and how clean they are.
Before you start
The dashboard is only as good as your records. If prices, purchase costs or dates are missing, we agree how to fill the gaps before the build. The sample above uses fictional data, and I will not publish your data anywhere without your written permission.
I will tell you what the dashboard would show and whether it is worth building.