Dealership sales and stock reporting in Power BI
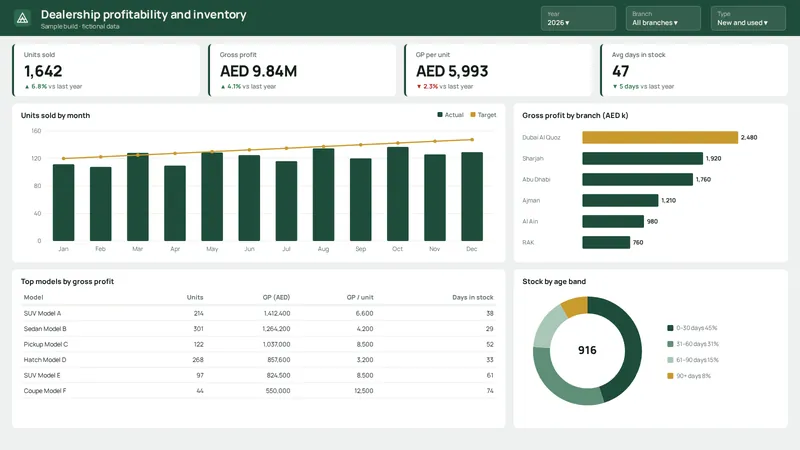
Replacing a monthly spreadsheet pack with one Power BI report for sales, gross profit and stock ageing across branches.
- ServicePower BI and data analytics
- Typical sectorAutomotive retail
The problem
Sales, gross profit and stock figures are exported from the dealer management system and combined by hand in Excel every week. Each branch calculates gross profit slightly differently, so totals rarely match, and aged stock is noticed late.
What gets built
- Power Query steps that load and clean the DMS and spreadsheet exports
- A star-schema data model with vehicles, branches, salespeople and dates
- DAX measures for gross profit per unit, days in stock and target attainment, with one agreed definition each
- Report pages for the managing director, sales managers and the stock controller
- A scheduled refresh and a handover guide for maintaining the report
What it aims for
- Aim: cut weekly reporting from hours of spreadsheet work to a scheduled refresh
- Aim: one definition of gross profit used by every branch
- Aim: see aged stock early enough to act on it
Typical tools
- Power BI
- Power Query
- DAX
- Excel
- SQL
This is an example engagement describing a typical project. It is not a client case study, and the aims are goals rather than measured results.